Middle school maths, year 3 · unit 7
Spread of Data and Correlation
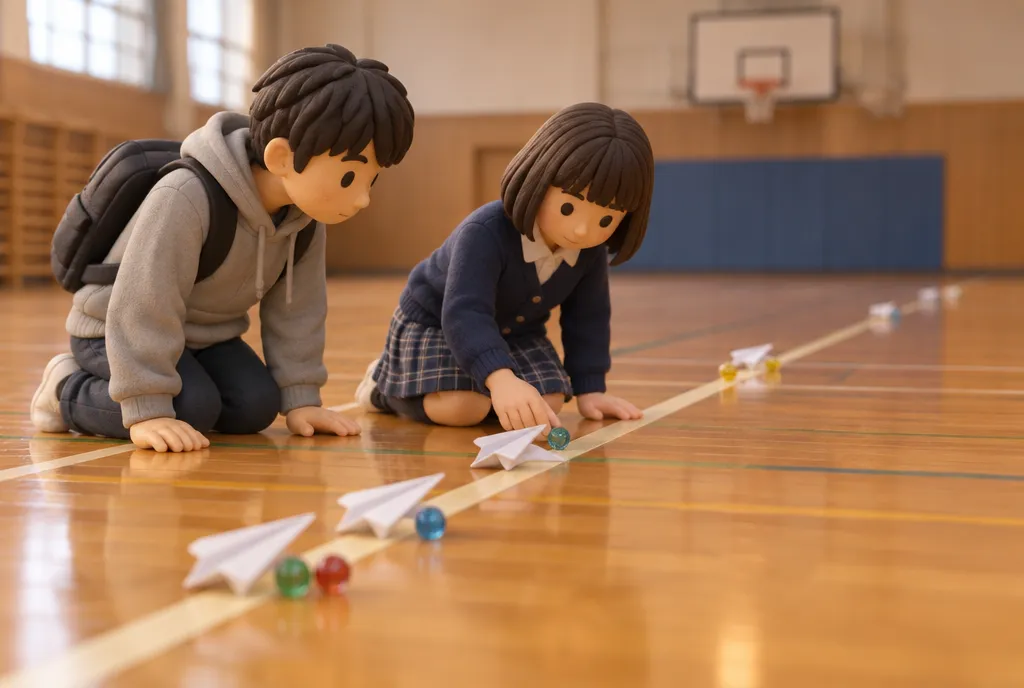
If two archers both average 9 points, whom would you pick for the team? One always lands round 9; the other swings between 10 and 7. The means are the same but the spread is not. Let us measure spread with a single number, and draw pictures that show how two things change together. We start with five marbles on a number line.
Deviation
A board to adjustWhat do you get if you add up how far each value is from the mean? Drag the marbles to set the mean.
Variance and standard deviation
A board to adjustMeasure spread with a single number. Drag the marbles and the squares built on the deviations change.
Box plots
A board to adjustFind the three numbers that split the data into quarters and draw a box. Drag the handle to pick the middle marble.
Scatter plots and correlation
Joining boardPlot two things as points and the link shows. Draw a line from each scatter plot to its name.
Try it yourself
Use what you found on the boards. The numbers change every time and the easy questions come first. Get three right and the lamp lights.
What to take away from this unit
- Deviation = value − mean. The mean is the balance point, so the deviations always add up to 0.
- Variance = sum of (deviation)² ÷ number of values: the average area of squares with the deviations as sides.
- Standard deviation = √variance. The smaller it is, the closer the data are to the mean.
- In order, the middle is the median, the middle of the lower half the lower quartile and the middle of the upper half the upper quartile.
- A box plot is drawn from the minimum, lower quartile, median, upper quartile and maximum. The box holds the middle half of the data.
- If one grows as the other grows, that is positive correlation; if it shrinks, negative correlation. A correlation is not a cause.